Conservation Assessment Ranking Tool
Jason Nemecek and Steve Peaslee
March 5, 2025
The Conservation Assessment Ranking Tool (CART) is designed for use in the conservation planning process to assess resource concerns, planned practices, and site vulnerability. It ranks applications for conservation programs and provides conservation planners with information on existing and future resource concerns.
This documentation describes the SQL queries that access soils data for CART. The queries described in this documentation run through the Soil Data Access web service and are specifically written to support CART.
Structured Query Language (SQL) script for the Conservation Assessment Ranking Tool: Soil.
- SQL Server version: Click here
- Soil Data Access SQL version: Click here
- Area of Interest (AOI) Geometry examples to copy into the SQL script: Click here
- Prototype: Click here
- Prototype2: Click here
- Prototype3: Click here
The soils data used in CART can be found in four main sections.
- Resource Assessment (Resource Concerns);
- Soil Quality Degradation
- Other
- EP—Easement Program
- EE—Environmental Evaluation
- Outcome Results (Under Development)
| Datasets | Purpose* | Documentation | Section | |
|---|---|---|---|---|
| 1 | Ponding or Flooding | RA, EP | Click here | Excess Water-Ponding and Flooding, Easements |
| 2 | Depth to Water Table | RA, EP | Click here | Excess Water-Seasonal High Water Table, Easements |
| 3 | Hydric Rating by Map Unit | RA, EP | Click here | Excess Water: Seeps; Air Quality: Emissions of Greenhouse Gases; Easements |
| 4 | Nitrogen Leaching | RA | Click here | Future Development (Water Quality-Diffuse Nutrient, Pesticide and Pathogens Transport to Surface Water) |
| 5 | Farmland Classification | EE, EP | Click here | Easements; Environmental Evaluation |
| 6 | Available Water Storage | EP | Click here | Easements |
| 7 | Soil Organic Carbon Stock | RA, EP | Click here | Easements; Air Quality: Emissions of Greenhouse Gases |
| 8 | Drainage Class | EP | Click here | Easements |
| 9 | Organic Soils | RA | See ‘Hydric Rating by Mapunit’ | — |
| 10 | Agricultural Organic Soil Subsidence | RA | Click here | Soil Quality Degradation: Subsidence |
| 11 | Soil Susceptibility to Compaction | RA | Click here | Soil Quality Degradation:Compaction |
| 12 | Soil Susceptibility Organic Matter Depletion | RA | Click here | Soil Quality Degradation:Organic Matter Depletion |
| 13 | Surface Salt Concentration | RA | Click here | Soil Quality Degradation:Concentration of Salts and Other Chemicals |
| 14 | Limitation for Aerobic Soil Organisms | RA | Click here | Soil Quality Degradation:Soil Organism Habitat Loss and Degradation |
| 15 | Aggregate stability | RA | Click here | Soil Quality Degradation:Aggregate Instability |
| 16 | Domain Tables | — | Click here | — |
| 17 | Soil Property List by Interpretation | — | Click here | — |
| 18 | Soil Property List and Column Descriptions | — | Click here | — |
| 19 | Data Checks | — | Click here | — |
| 20 | Outcomes | — | Click here | — |
| 21 | Future Development | — | Click here | — |
| 22 | CART User’s Guide | — | Click here | — |
| 23 | CART Overview | — | Click here | — |
| 24 | Soil Data Access Metrics | — | Click here | — |
*RA—Resource Assessment; EP—Easement Program; EE—Environmental Evaluation; RT—Ranking Tool
Soil properties can be divided into two broad categories: intrinsic and non-intrinsic. Intrinsic soil properties are those empirical soil properties that are not based on any other soil properties. Non-intrinsic soil properties involve calculations that are based on measured or observed soil properties.
Resource Concerns
Soil Quality Degradation
CART evaluates six resource concerns related to soil quality degradation. Each involves analysis of soil interpretation data from the Soil Data Access Query service. Soil maps and reports for these resource concerns are generated dynamically for each land unit being assessed.
| Resource Concerns | Related Soil Interpretation | |
|---|---|---|
| 1 | Subsidence | Agricultural Organic Soil Subsidence |
| 2 | Compaction | Soil Susceptibility to Compaction |
| 3 | Organic Matter Depletion | Organic Matter Depletion |
| 4 | Concentration of Salts and Other Chemicals | Surface Salt Concentration |
| 5 | Soil organism habitat loss or degradation | Suitability for Aerobic Soil Organisms |
| 6 | Aggregate instability | Aggregate stability |
Soil Data Access Requests by CART
- The request for soils data begins once land units have been selected (fig. 1).
- The request is in the form of an SQL query and contains:
- Land unit identifier
- Bounding coordinates
- CART automatically sends the request to Soil Data Access Query Service.
- Map layers are processed in the background and are not displayed.
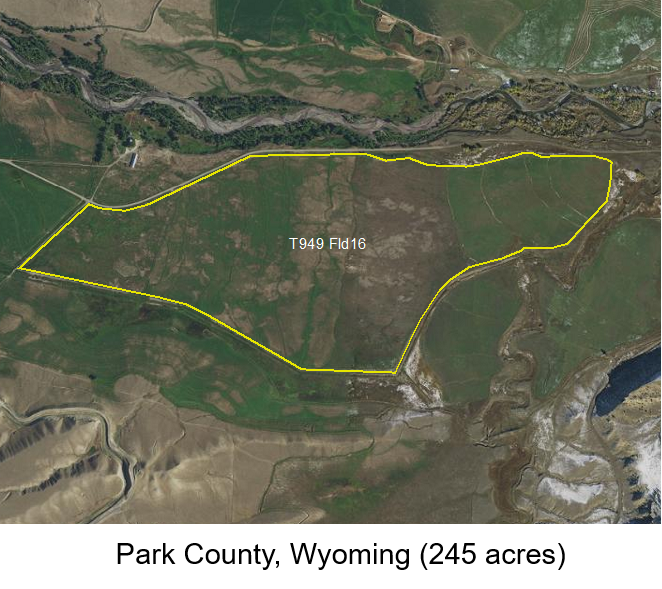
Figure 1.—This map is here to show you a landunit in Park County, Wyoming.
MAP DATA PROCESSING
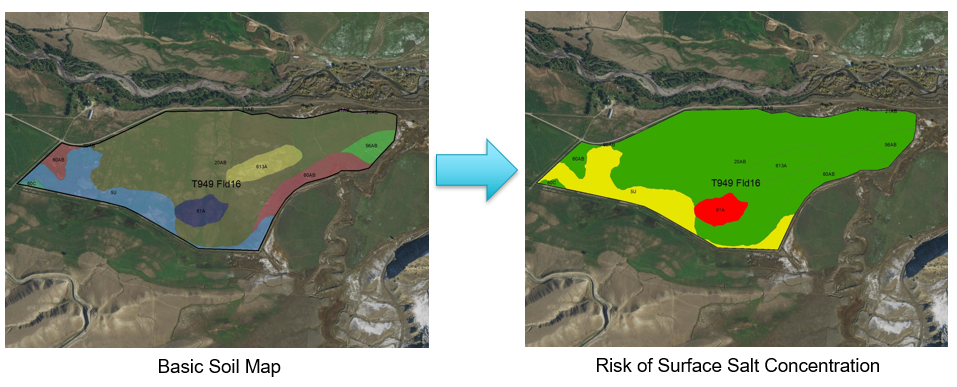
Figure 2.—A map of the soils in the selected area and a map showing the soil interpretation for surface salt concentration.
Map data is processed in the background. In figure 2, the map on the left shows 8 different soils within a land unit. The map on the right illustrates risk of surface salinization. The red polygons indicate the most severe areas and are assigned a rating of 1. The map is not intended for on-screen display in CART, but the information from these background map layers is used to calculate the final resource concern rating.
Service Data
In the following table, the query service returned soils information for ”Risk of Surface Salt Concentration” within the land unit. The soil interpretation rating was used to calculate the CART resource concern rating.
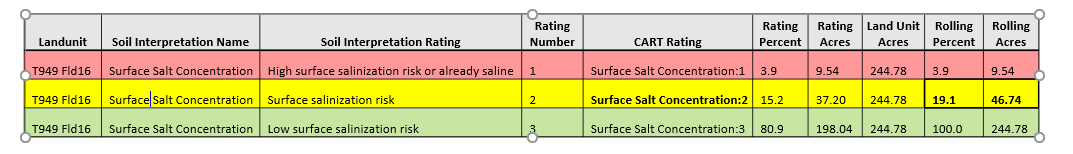
Areas with the highest risk are assigned a rating of 1. Areas with a lower risk are assigned a larger rating number. Rating values are calculated using soils data at the component level.
Land unit Detailed Ratings
The service request calculates the rolling sum values for rating acres and rating percent for each resource concern and finds the single most limiting rating (per land unit) that comprises at least 10 percent of the landunit area or 10 acres, whichever is less.
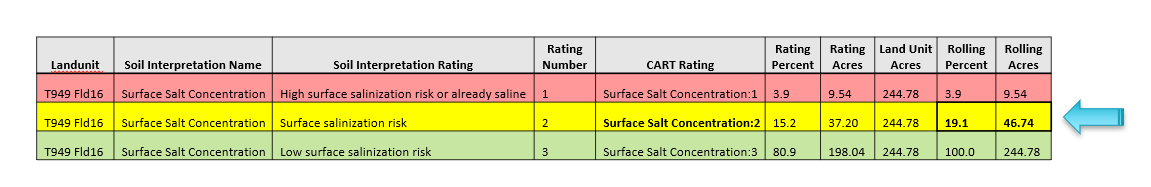
In this example, the most limiting rating that meets these criteria is the second row. This rating is provided to the CART application as the land unit rating for Concentration of Salts and Other Chemicals.
Final Land unit Ratings
For each of the resource concerns, the final land unit ratings (which are derived from Soil Data Access) are returned to CART for awarding of points. The publication date of the soils data is also returned for display.
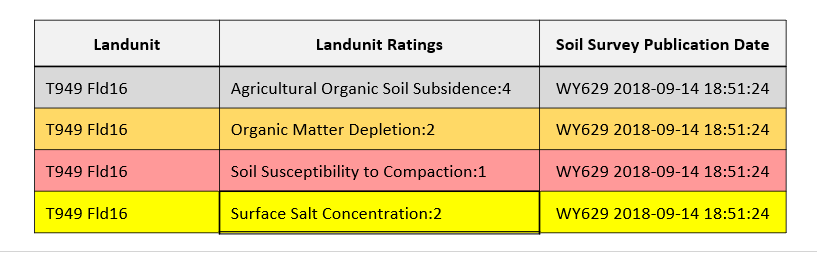
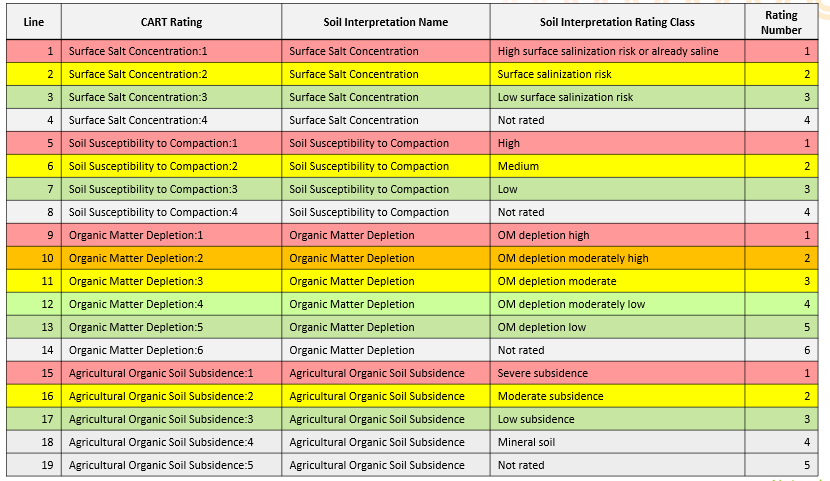
The following domain table contains an ordered list of all possible rating values.
EASEMENTS
Click a heading below for specific information on a listed query.
- Soil Organic Carbon Stock
- Farmland Classification
- Hydric Soil Rating by Map Unit
- Ponding or Flooding Frequency
- Depth to Water Table
- Drainage Class
- Available Water Storage
Environmental Evaluation (CPA-52)
Click a heading below for specific information on a listed query.
Outcomes
The programming proposed for outcomes is intended to provide NRCS leadership with the ability to model data and report the natural resource impacts and outcomes of conservation practices, systems, and projects. The integration of outcomes into CART is still under development.
- Outcomes Design Concept: Click here
- Data connections (CART-NPAD): Click here
Acknowledgements
- Steve Campbell: Soil Scientist, NRCS
- Skye Wills: Soil Scientist, NRCS
- Chad Volkman: Cartographer, NRCS
- Phil Anzel: Senior Software Developer, Vistronix
- Susan McGlasson: Database Administrator, Vistronix
- Bob Dobos: Soil Scientist, NRCS
- Cathy Seybold: Soil Scientist, NRCS
- Jeff Thomas: Soil Scientist, NRCS
- Mike Robotham: National Leader for Technical Soil Services, NRCS
- Laura Morton: Management Analyst, NRCS
- Aaron Lauster: National Sustainable Agriculture Leader, NRCS
- Casey Sheley: Natural Resource Specialist, NRCS
- Eric Hesketh: Soil Scientist, NRCS
- Greg Zwicke: Environmental Engineer, NRCS
- Matt Flint: Natural Resource Specialist, NRCS
- Danielle Balduff: Natural Resource Specialist, NRCS
- Breanna Barlow: Management Analyst, NRCS
- Barry Fisher: Central Region Soil Health Team Leader, NRCS
- Robin Plummer: Developer, NRCS
- Aaron Bustamante:
- Pam Thomas: Associate Director of Soil Survey Programs, NRCS
With support from the Resource Concern Team and Workgroups.